已传文件:photo/1793926547.png
 Tumor-draining lymph nodes are central to anti-tumor immunity and shape responses to immunotherapy. Colorectal cancers with microsatellite instability and microsatellite stability exhibit marked differences in tumor biology, prognosis, and sensitivity to immune checkpoint blockade. Nevertheless, the distinctions in draining lymph nodes between these two subtypes and their contributions to divergent anti-tumor immune responses remain poorly understood. In this study, we performed integrative multi-omic analyses to systematically compare the tumor-draining lymph nodes and tumor microenvironment across these two colorectal cancer subtypes. We identified a unique CD8⁺ T cell population that displays terminal exhaustion yet retains potent anti-tumor activity. These cells are highly tumor-reactive, correlate with tertiary lymphoid structure formation, and are enriched in microsatellite-instable colorectal cancer. Lineage tracing demonstrated that they originate from tumor-draining lymph nodes. In microsatellite-instable colorectal cancer, tumor-draining lymph nodes harbor more pre-exhausted T cells, dendritic cells with augmented antigen-presentation capacity, and fewer regulatory T cells, thereby providing precursors and a supportive niche for the development of these effector-exhausted T cells. Within the tumor compartment, IL21⁺ CD4⁺ T cells and CXCL10⁺ myeloid cells further promote the differentiation and recruitment of these cells via cytokine signaling and upregulate major histocompatibility complex expression. Microsatellite-instable colorectal cancer cells reinforce this immune ecosystem by activating the cyclic GMP-AMP synthase–stimulator of interferon genes pathway. Collectively, our findings identify effector-exhausted CD8⁺ T cells as critical mediators of favorable immunity in microsatellite-instable colorectal cancer and highlight the pivotal role of tumor-draining lymph nodes in sculpting the tumor immune landscape.
This study was published in Signal Transduction and Targeted Therapy under the title “Tumor-draining lymph nodes shape the tumor microenvironment through enrichment of tumor-reactive effector-exhausted CD8⁺ T cells”.
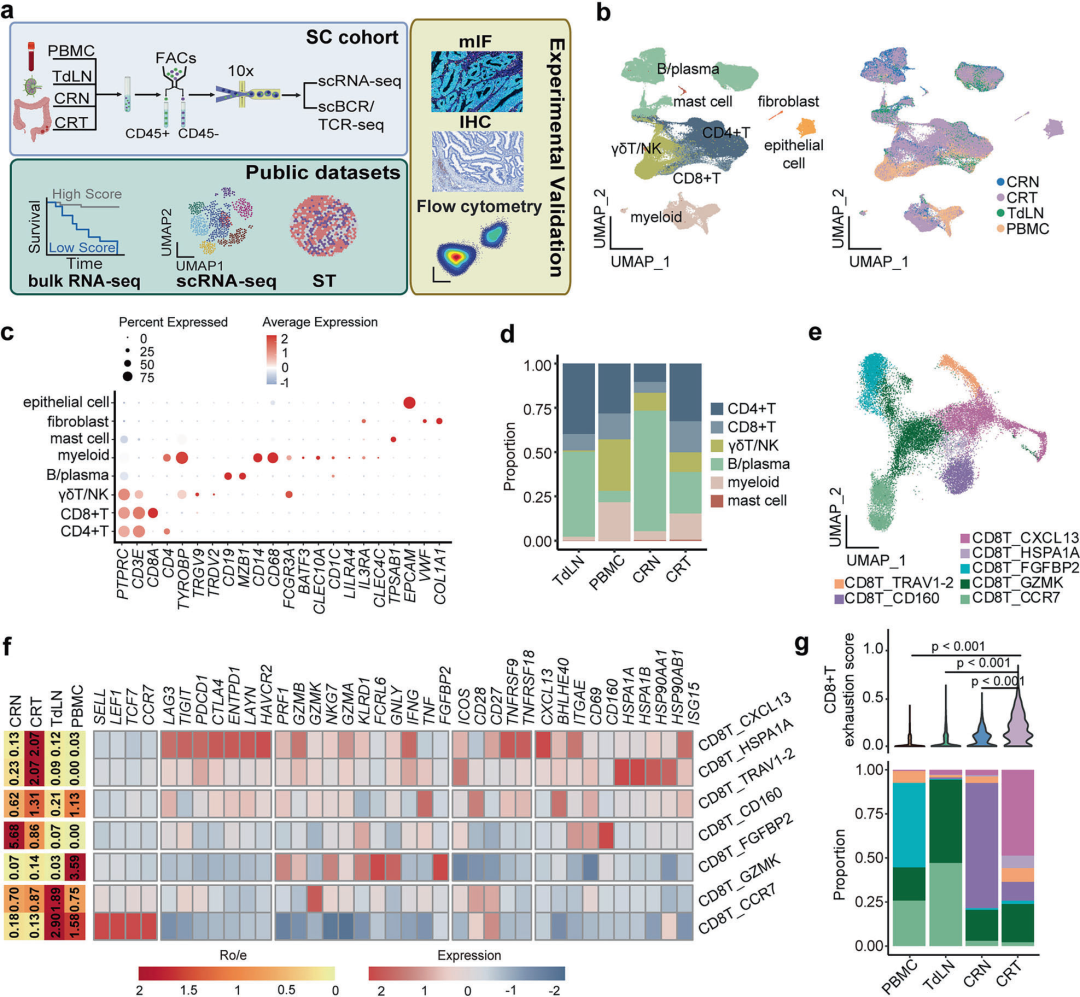
Figure 1
Single-cell landscape of the immune microenvironment in MSI and MSS colorectal cancer. Schematic overview of the study design and data sources. b UMAP projection of 195,298 cells annotated by cluster identity and tissue origin. c Dot plot of representative marker genes highlighting distinct transcriptional profiles across major cell clusters. d Stacked bar chart showing the relative abundance of major immune cell types in each tissue. e UMAP visualization of seven CD8⁺ T cell subsets across all samples. f Heatmap illustrating the tissue distribution and signature gene expression of CD8⁺ T cell subclusters. g Top: Violin plots comparing the expression of exhaustion-associated genes in CD8⁺ T cells across different tissue types; Bottom: Stacked bar chart showing the proportions of CD8⁺ T cell subclusters in different tissue types.
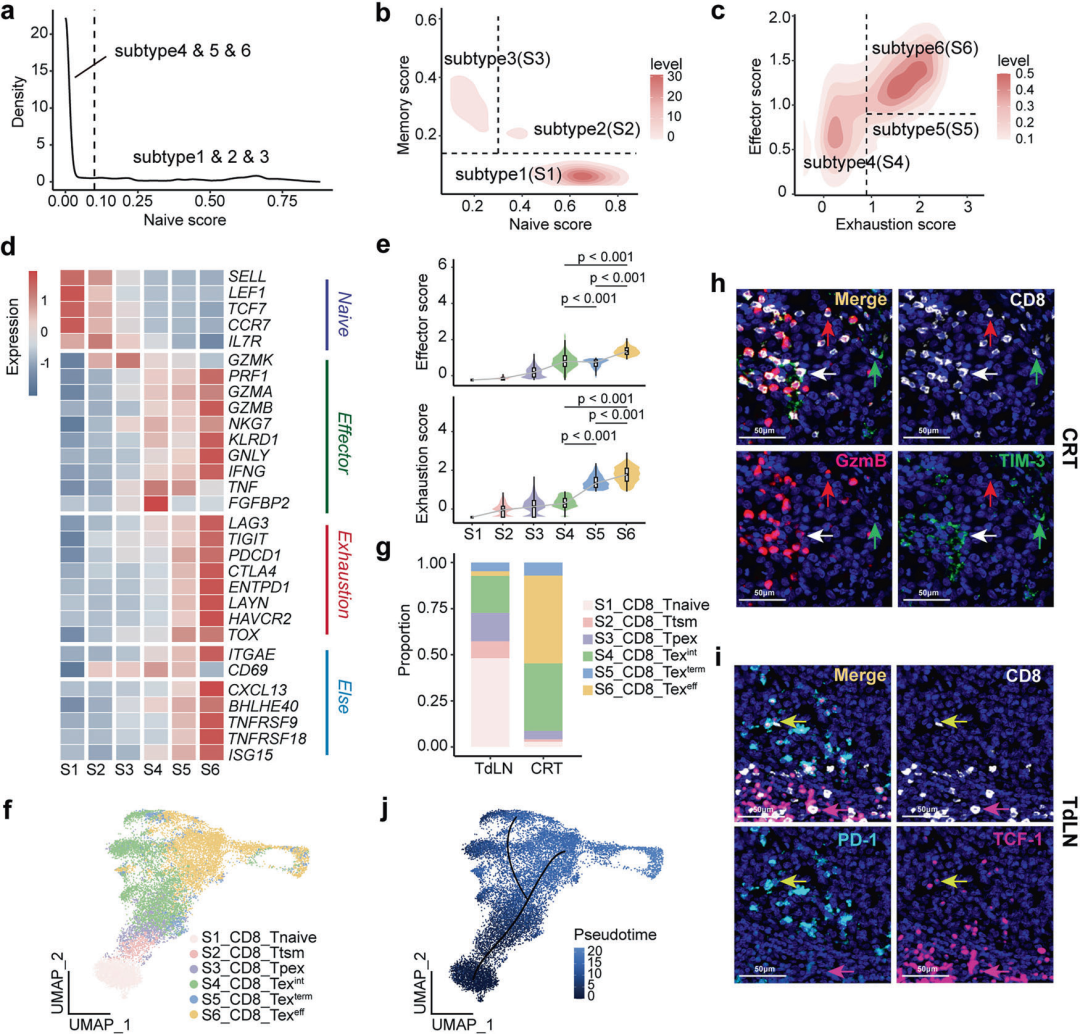
Figure 2
Distinct exhaustion states of CD8⁺ T cells in CRC TdLNs and the TME. a–c Density plots showing the distribution of CD8⁺ T cells based on key transcriptional scores. a Cells were initially classified into stem-like (subclusters 1–3) and non-self-renewing (subclusters 4–6) populations according to the naïve score. b Stem-like cells were further refined using combined naïve and memory scores. c The remaining exhausted cells were categorized by effector and exhaustion scores. d Heatmap showing the expression of representative markers across the six subclusters. e Violin plots comparing effector scores and exhaustion scores among the six CD8⁺ T cell subclusters. f UMAP visualization of the six CD8⁺ T cell subclusters. g Bar chart showing the proportions of CD8⁺ T cell subclusters in TdLNs and tumors. h, i In situ validation of distinct CD8⁺ T cell phenotypes via mIF. h Co-expression of CD8 (white), TIM-3 (green), and GzmB (red) identifies exhausted subsets in tumors: GzmB⁺TIM-3⁺ (white arrows), GzmB⁺TIM-3⁻ (red arrows), and GzmB⁻TIM-3⁺ (green arrows); cells marked by white arrows correspond to the CD8_Tex subset. i Co-expression of CD8 (white), PD-1 (cyan), and TCF-1 (purple) in TdLNs highlights the PD-1⁺TCF-1⁺ (yellow arrows) and PD-1⁻TCF-1⁺ (purple arrows) subsets; cells marked by yellow arrows correspond to the CD8_Tpex subset. j Pseudotime trajectory analysis delineates the differentiation pathway among CD8⁺ T cells.
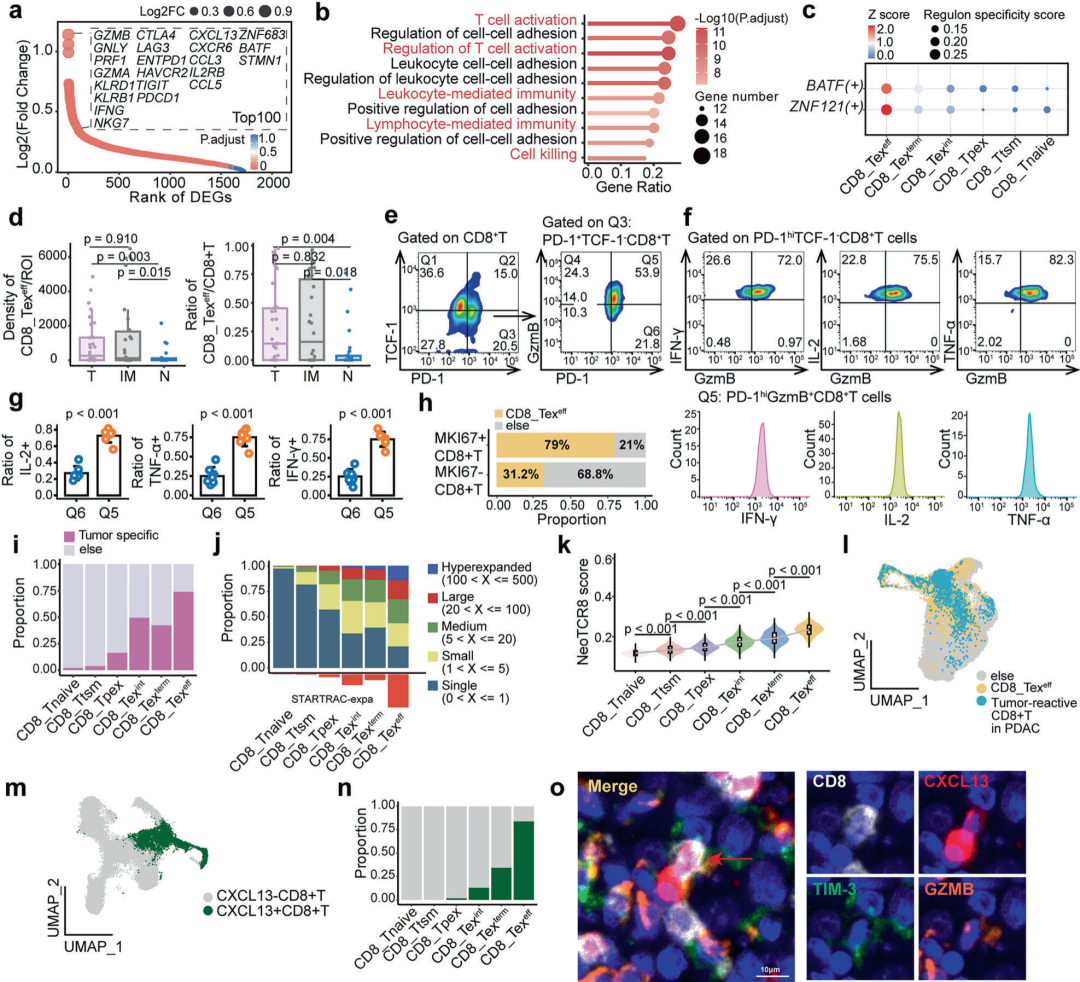
Figure 3
CD8_Texeff cells possess potent cytotoxicity, proliferative potential and tumor specificity. a The top 100 differentially expressed genes (DEGs, adjusted P < 0.05) in CD8_Texeff cells include canonical cytotoxic effector genes, immune checkpoint genes and chemokine genes. b Pathway enrichment analysis based on genes highly expressed in CD8_Texeff cells. c Regulon activity analysis of BATF and ZNF121 across distinct states of exhausted CD8⁺ T cells, showing regulon activity Z-scores and regulon specificity scores (RSS). d Box plot from multiplex immunofluorescence (mIF) analysis showing CD8_Texeff cells in different regions (T, IM, N). T, tumor core; IM, invasive margin; N, normal colorectal tissue. e Gating strategy for flow cytometry to define CD8⁺ T cell subsets based on the expression of TCF-1, PD-1 and GzmB in colorectal cancer (CRC) tumor tissues. Q1: Naive T cells (Tnaive, TCF-1⁺PD-1⁻CD8⁺ T cells); Q2: Pre-exhausted T cells (Tpex, TCF-1⁺PD-1⁺CD8⁺ T cells); Q4: Intermediately exhausted CD8⁺ T cells (CD8_Texint, TCF-1⁻PD-1low CD8⁺ T cells); Q5: Effector-exhausted CD8⁺ T cells (CD8_Texeff, TCF-1⁻PD-1highGzmB⁺CD8⁺ T cells); Q6: Terminally exhausted CD8⁺ T cells (CD8_Texterm, TCF-1⁻PD-1highGzmB⁻CD8⁺ T cells).
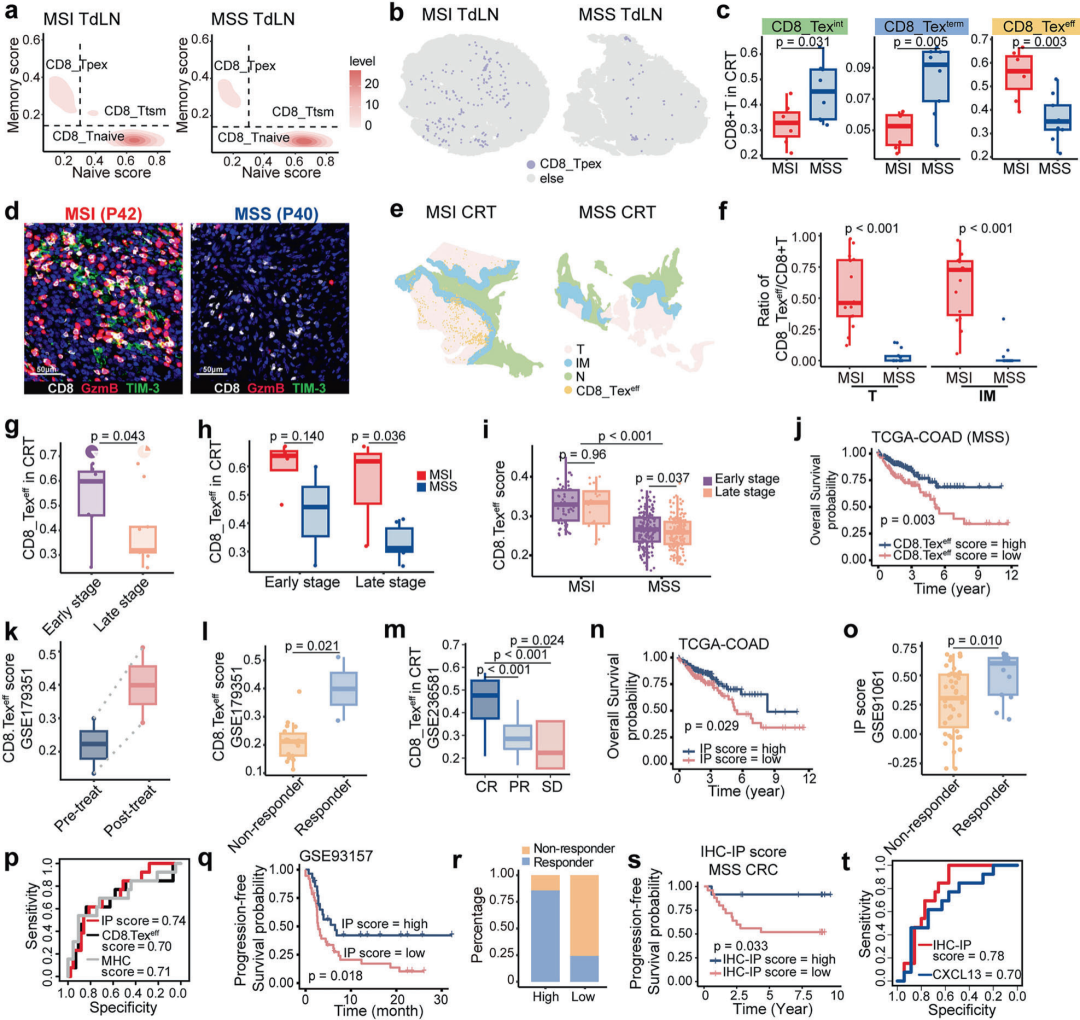
Figure 4
The abundance of CD8_Texeff cells is associated with microsatellite status, tumor stage, prognosis and immunotherapy response. a Density plots showing CD8⁺ T cell subsets in tumor-draining lymph nodes (TdLNs) from patients with microsatellite-instable (MSI) and microsatellite-stable (MSS) colorectal cancer. b Representative panoramic multiplex immunofluorescence (mIF) images of tumor-draining lymph nodes (TdLNs) from MSI and MSS colorectal cancer patients; TCF-1⁺PD-1⁺CD8⁺ T cells are defined as CD8_Tpex. c Box plots comparing the proportions of CD8_Texeff, CD8_Texint and CD8_Texterm cells in the tumor microenvironment (TME) between MSI and MSS colorectal cancer. d Representative multiplex immunofluorescence (mIF) images showing regions enriched for CD8_Texeff cells in sample P40 (MSS) and sample P42 (MSI). e Representative panoramic multiplex immunofluorescence (mIF) images of tumor samples from MSI and MSS colorectal cancer patients; GzmB⁺TIM-3⁺CD8⁺ T cells are defined as CD8_Texeff. f Box plots based on multiplex immunofluorescence (mIF) analysis showing CD8_Texeff cells in different regions (tumor core T, invasive margin IM), with comparisons between MSI and MSS patients. T, tumor core; IM, invasive margin. g Box plot comparing the abundance of CD8_Texeff cells between early-stage and advanced-stage colorectal cancer; pie chart illustrating the proportion of patients with high and low CD8_Texeff abundance stratified by the median value. h Box plot showing the proportion of CD8_Texeff cells in colorectal cancer stratified by tumor stage and microsatellite status.
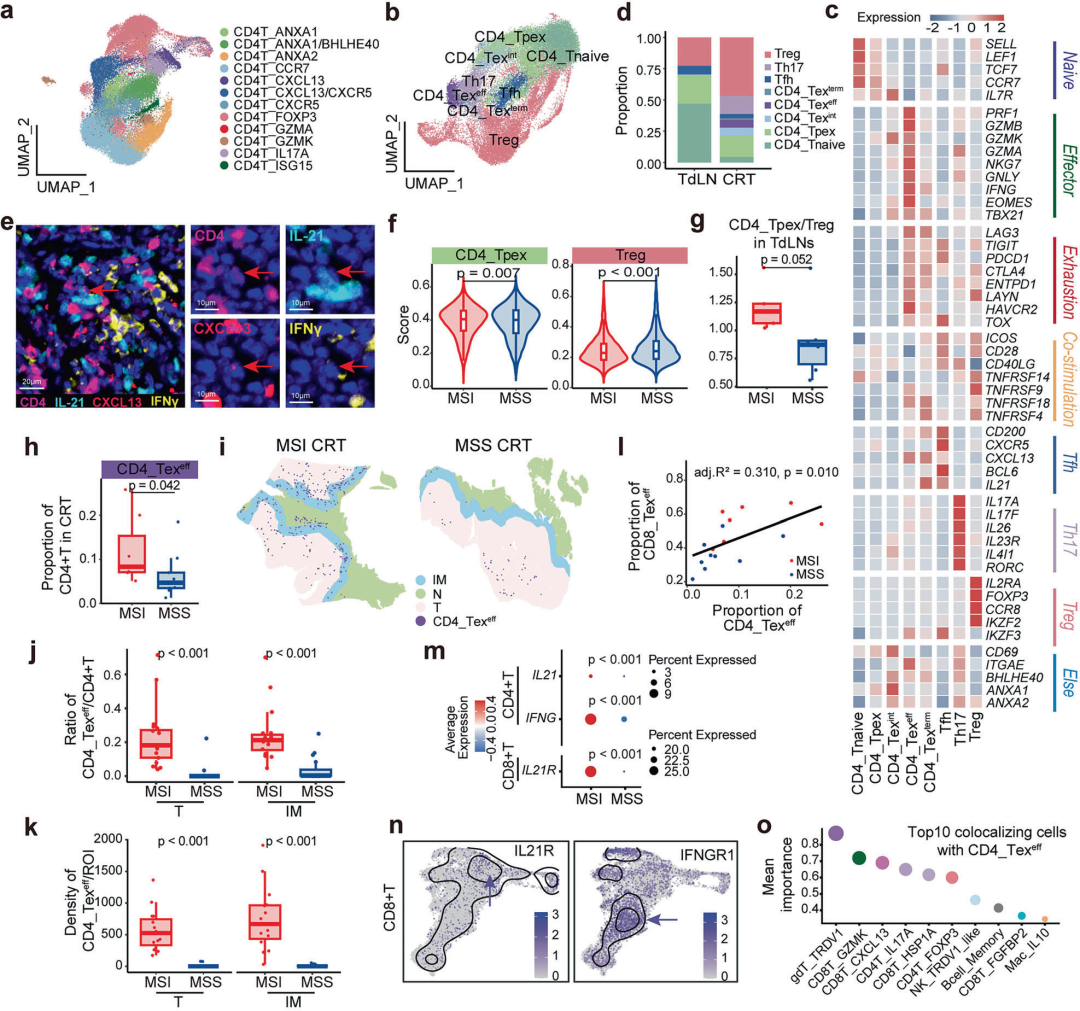
Figure 5
The ratio of CD4_Tpex to Treg cells in TdLNs modulates the differentiation and enrichment of CD8_Texeff cells in the tumor microenvironment. a UMAP plot showing twelve distinct CD4⁺ T cell subsets in colorectal cancer. b UMAP plot showing follicular helper T cells, Th17 cells, regulatory T cells, and five CD4⁺ T cell subtypes. c Heatmap showing the expression of key markers for CD4⁺ T cell subtypes, follicular helper T cells, Th17 cells and regulatory T cells. d Stacked bar chart showing the distribution of CD4⁺ T cell subtypes in tumor-draining lymph nodes and tumor tissues. e Multiplex immunofluorescence image showing IL-21⁺IFN-γ⁺CXCL13⁺CD4⁺ T cells; purple, cyan, red and yellow indicate the expression of CD4, IL-21, CXCL13 and IFN-γ, respectively; red arrows mark IL-21⁺IFN-γ⁺CXCL13⁺CD4⁺ T cells. f Violin plots comparing the signature scores of CD4⁺ T cell subtypes in tumor-draining lymph nodes between microsatellite-instable and microsatellite-stable groups. g Box plot showing an elevated CD4_Tpex/Treg ratio in tumor-draining lymph nodes of microsatellite-instable tumors. h Box plot showing the enrichment of Th1-like CD4_Texeff cells in the tumor microenvironment of microsatellite-instable colorectal cancer. i Representative panoramic multiplex immunofluorescence images of tumor samples from microsatellite-instable and microsatellite-stable colorectal cancer; IL-21⁺IFN-γ⁺CD4⁺ T cells are defined as CD4_Texeff.
Summary
This study aims to uncover the mechanisms underlying the divergent immunotherapy responses between microsatellite-instable (MSI) and microsatellite-stable (MSS) colorectal cancer. Using integrative multi-omics approaches, the research team systematically compared the tumor-draining lymph nodes (TdLNs) and tumor microenvironment of these two subtypes. The team identified a unique CD8⁺ T cell population with a "terminally exhausted" phenotype that retains potent anti-tumor activity. Lineage tracing confirmed that these cells are directly derived from TdLNs. This finding clarifies, at the cellular level, the central role of lymph nodes in delivering highly functional tumor-reactive T cells to the tumor microenvironment.
This discovery delineates the coordinated microenvironmental network that enables robust anti-tumor immunity in MSI colorectal cancer. TdLNs serve as a nurturing niche for effector T cell development by supplying abundant pre-exhausted T cell precursors and high-quality dendritic cells. Once recruited into tumors, these cytotoxic cells undergo differentiation and recruitment with combined support from IL21⁺ CD4⁺ T cells, CXCL10⁺ myeloid cells, and the cGAS–STING pathway in cancer cells themselves. These results suggest that future immunotherapeutic strategies should not only target the tumor site but also explore approaches to activate draining lymph nodes or remodel the multicellular cooperative ecosystem to break immune tolerance.
Reference:
DOI:10.1038/s41392-026-02858-3
We specialize in custom nano-medical functional materials. We conduct targeted development to tailor structure, particle size and surface modification for your experiments. Full characterization, iterative optimization and technical support are available for targeted delivery, bioimaging and nanomedicine studies. Send your evaluation plans to us.
Engineer Zhang: 17715390137
Engineer Chen: 18914047343