已传文件:photo/1793847023.png
 This study was published in Cell under the title “Perforin triggers iron-induced mitochondrial damage to drive ferroptosis and anti-tumor immunity”.
Cytotoxic CD8⁺ T cells and natural killer cells are key effector cells of anti-tumour immunity. Cytotoxic lymphocytes eliminate tumour cells by releasing perforin (Prf1), a pore-forming protein that enables granzymes (Gzms) to enter target cells and initiate caspase-dependent and caspase-independent cell death. Here we identify a previously unrecognized granzyme-independent function of perforin. We show that perforin can directly induce tumour ferroptosis, an iron- and lipid-dependent form of cell death. Mechanistically, perforin-mediated pore formation drives endocytosis of the transferrin receptor, thereby increasing cellular iron uptake. Perforin promotes the formation of endosome–mitochondria contacts, which leads to mitochondrial iron accumulation, mitochondrial dysfunction and ferroptosis in tumour cells. In mouse tumour models, dietary iron supplementation suppresses tumour progression in a perforin-dependent manner. In human cancer patients, higher perforin expression levels correlate with improved survival and enhanced responses to immune checkpoint blockade therapy. These findings define a granzyme-independent function of perforin that directly executes cancer cell death via ferroptosis.
Quick Look at Literature
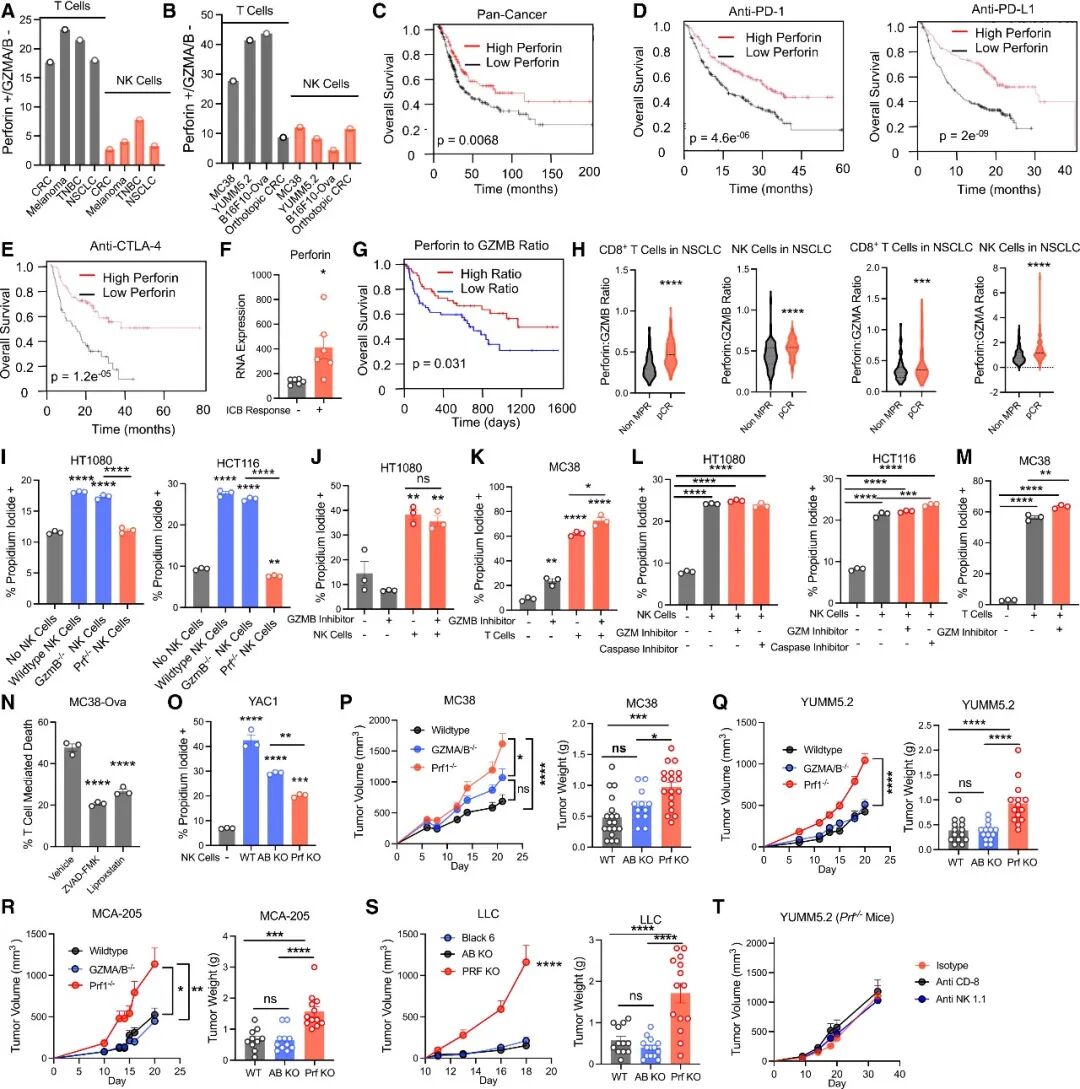 Figure 1
(A) Proportions of T cells and NK cells expressing perforin but not granzyme (Gzm) A/B in human single-cell RNA-seq datasets from colorectal cancer (CRC), melanoma, triple-negative breast cancer (TNBC) and non-small-cell lung cancer (NSCLC).
(B) Proportions of T cells and NK cells in MC38, YUMM5.2, B16F10-OVA and orthotopic colorectal cancer organoid models.
(C) Pan-cancer RNA-seq patient samples stratified into high- and low-perforin expression groups for survival comparison. n = 7489.
(D,E) Disease-free survival analysis of a combined tumour cohort stratified by perforin expression following treatment with anti-PD-1 (n = 520), anti-PD-L1 (n = 486) or anti-CTLA-4 (n = 121).
(F) Mean perforin expression levels in immune checkpoint blockade (ICB) responders versus non-responders from the aggregated ICB Atlas21 sequencing dataset with statistically significant differences.
(G) Overall survival analysis of melanoma patients receiving ICB therapy stratified by the expression ratio of perforin to granzyme B. n = 109.
(H) Pseudo-bulked single-cell RNA-seq data from NSCLC patients partitioned into CD8⁺ T cells and NK cells. Expression ratios of perforin to granzyme A or B were calculated and assessed against pathological complete response (pCR), major pathological response (MPR) and non-major pathological response (non-MPR). n = 221.
(I) HT1080 and HCT116 cells were co-cultured with wild-type (WT), GzmB⁻/⁻ or Prf1⁻/⁻ human YT-INDY NK cells for 4 h, followed by propidium iodide staining and flow cytometry analysis.
(J,K) HT1080 and MC38 cells were pre-treated with 1 μM granzyme B inhibitor I for 16 h before co-culture with NK cells for 4 h or T cells for 24 h, followed by propidium iodide staining and flow cytometry analysis.
(L) NK cells were pre-treated with 250 μM 3,4-dichloroisocoumarin for 30 min or 5 μM ZVAD-FMK for 30 min prior to co-culture with the indicated tumour cell lines for 4 h.
(M) MC38 cells were pre-treated with 250 μM 3,4-dichloroisocoumarin for 30 min before co-culture with T cells for 24 h, followed by propidium iodide staining and flow cytometry analysis.
(N) MC38-OVA cells were pre-treated with the indicated cell death inhibitors for 16 h. OT-I cells isolated from the spleen were co-cultured at a ratio of 1:32.
(O) A total of 100,000 MC38 cells were injected intraperitoneally to recruit NK cells. Peritoneal NK cells were harvested 72 h later, and cytotoxicity was measured after 24 h of co-culture.
(P–S) MC38 (P), YUMM5.2 (Q), MCA-205 (R) and LLC (S) cells were inoculated bilaterally into the flanks of wild-type C57BL/6, GzmA/B⁻/⁻ or Prf1⁻/⁻ mice. Tumour volume was measured with calipers, and tumour weight was recorded at the experimental endpoint. n = 6–9 mice for P; n = 7 mice for Q; n = 5–6 mice for R; n = 6–7 mice for S.
(T) YUMM5.2 tumours were subcutaneously implanted into Prf1⁻/⁻ mice. On day 0 and every 7 days thereafter, 100 μg of anti-NK1.1 antibody or anti-CD8 antibody was injected intraperitoneally. n = 5–6 mice.
Statistical differences were assessed by one-way ANOVA or t-test. *p < 0.05, **p < 0.01, ***p < 0.001, ****p < 0.0001. In vitro data are presented as mean ± s.e.m. Representative experiments with consistent results from at least three independent biological replicates are shown; statistical analyses were performed on technical replicates within the representative experiment.
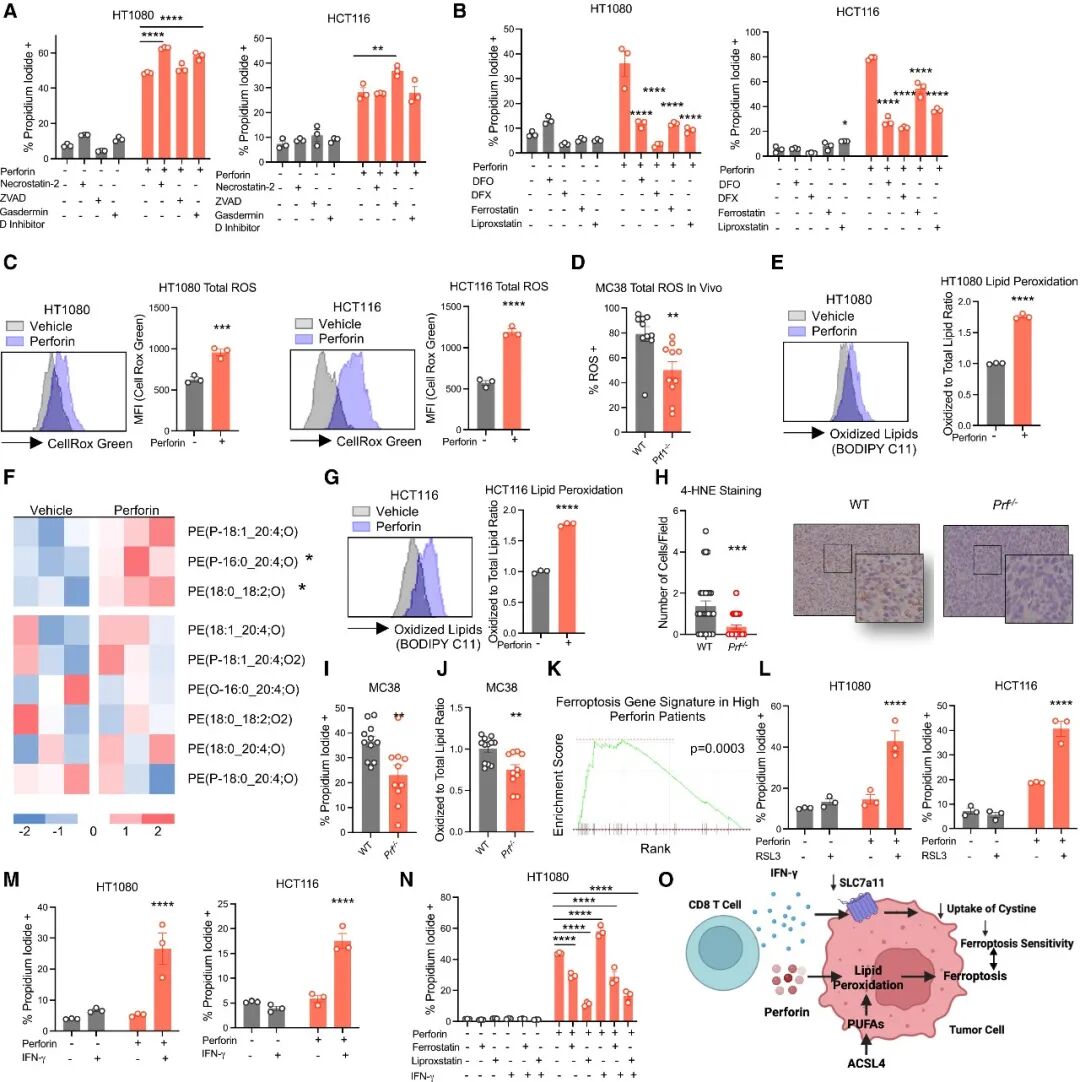 Figure 2
(A) HT1080 and HCT116 cells were pre-treated with the pyroptosis inhibitor LDC7559 (20 μM), necrostatin-2 (10 μM) or ZVAD-FMK (5 μM) for 16 h, followed by treatment with perforin together with cell death inhibitors. Cell death was assessed 4 h later. No significance is indicated for the control group.
(B) HT1080 and HCT116 cells were pre-treated with liproxstatin-1 (3 μM), ferrostatin-1 (3 μM), deferasirox (50 μM) or deferiprone (50 μM) for 16 h before perforin treatment. Cell death was assessed 4 h later.
(C) HT1080 and HCT116 cells were treated with perforin for 4 h, stained with CellROX Green, and the mean fluorescence intensity (MFI) was quantified.
(D) MC38 cells were inoculated into wild-type C57BL/6 and Prf1⁻/⁻ mice. Mice were euthanized at the experimental endpoint. Tumour tissues were digested with collagenase and stained with CellROX Green. The tumour cell population was gated, and the proportion of CellROX Green-high positive cells was quantified.
(E) HT1080 cells were treated with perforin for 4 h, stained with BODIPY C11, and the ratio of oxidized lipids to total lipids was normalized and plotted.
(F) Lipidomic analysis of HT1080 cells treated with sublytic concentrations of perforin for 4 h. Lipid levels were normalized to the total lipid content within each class and calibrated against the vehicle control group.
(G) HCT116 cells were treated with perforin for 4 h, stained with BODIPY C11, and the ratio of oxidized lipids to total lipids was normalized and plotted.
(H) MC38 tumour cells were subcutaneously implanted into C57BL/6 or Prf1⁻/⁻ mice. Tumour tissues were collected at the endpoint for 4-HNE staining. Regional image analysis was performed to quantify the number of positive cells per field of view; representative images are shown, n = 3–5 mice per group.
(I,J) On day 0, MC38 cells were injected intraperitoneally into wild-type and Prf1⁻/⁻ mice to activate NK cells; labelled MC38 cells were injected intraperitoneally on day 2. Cells were harvested on day 3, stained with propidium iodide and BODIPY C11, and CellTrace Violet-positive tumour cells were gated for analysis.
(K) In the colorectal cancer patient dataset (GSE178341), patients with high perforin expression in T and NK cells exhibited upregulated enrichment of the ferroptosis gene signature (WikiPathway Ferroptosis, WP4313). A total of 62 patients were included, stratified by the median perforin expression into a high-expression group (n = 31) and a low-expression group (n = 31).
(L) HT1080 or HCT116 cells were pre-treated with RSL3 (0.25 μM) for 16 h before co-incubation with perforin for 4 h; HT1080 or HCT116 cells were pre-treated with IFN-γ (10 ng ml⁻¹) for 16 h before co-incubation with perforin for 4 h, and cell death was measured.
(N) HT1080 cells were pre-treated with IFN-γ (10 ng ml⁻¹), ferrostatin-1 (10 μM) or liproxstatin-1 (10 μM) for 16 h before co-incubation with perforin for 4 h, and cell death was measured.
(O) Schematic illustrating a potential model whereby perforin and IFN-γ synergistically induce ferroptosis in tumour cells.
Statistical significance was assessed by one-way ANOVA or t-test. *p < 0.05, **p < 0.01, ***p < 0.001, ****p < 0.0001. In vitro data are presented as mean ± s.e.m. Representative experiments with consistent results from at least three independent biological replicates are shown; statistical analyses were performed on technical replicates within the representative experiment.
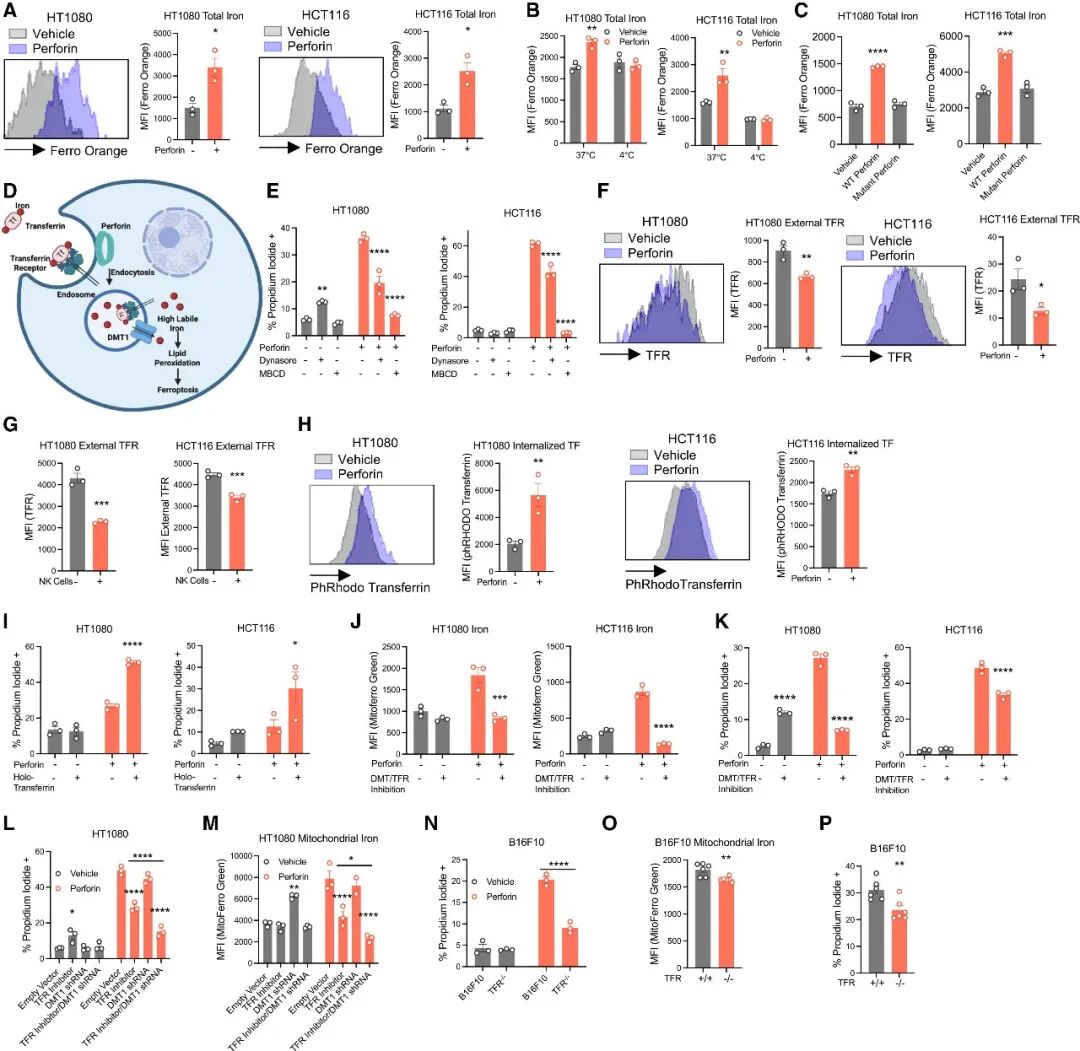
Figure 3
(A) HT1080 and HCT116 cells were treated with perforin for 4 h, stained with FerroOrange, live cells were gated, and the mean fluorescence intensity (MFI) of FerroOrange was measured.
(B) HT1080 and HCT116 cells were treated with perforin for 4 h at 4 °C or 37 °C, followed by FerroOrange staining. Live cells were gated for quantification of FerroOrange mean fluorescence intensity (MFI).
(C) HT1080 and HCT116 cells were treated with wild-type (WT) or TMH1 mutant perforin for 4 h, and cell death was assessed.
(D) Schematic working model of perforin-mediated cytotoxicity.
(E) HT1080 and HCT116 cells were pre-incubated with dynasore (5 μM) or methyl-β-cyclodextrin (0.5 μM) for 16 h, then co-treated with the corresponding inhibitor and perforin for 4 h before cell death analysis.
(F) HT1080 or HCT116 cells were treated with perforin for 4 h without permeabilization, followed by transferrin receptor (TFR) staining and flow cytometric acquisition.
(G) HT1080 or HCT116 cells were co-cultured with NK cells without permeabilization, stained with human transferrin receptor (TFR) antibody, and analysed by flow cytometry.
(H) HT1080 or HCT116 cells were pre-treated with perforin for 4 h, then incubated with pHrodo-labelled transferrin (TF) for 15 min.
(I) HT1080 or HCT116 cells were pre-incubated in serum-free medium containing holo-transferrin (holo-TF), followed by co-treatment with perforin and holo-TF for 4 h, and cell death was analysed.
(J,K) HT1080 or HCT116 cells were pre-incubated with DMT1 blocker 2 (5 μM) or ferristatin II (50 μM) for 16 h, then treated with perforin for 4 h. Mitochondrial iron levels and cell death were measured.
(L,M) Wild-type HT1080 cells or DMT1-knockout (DMT1⁻/⁻) HT1080 cells were pre-incubated with ferristatin II (50 μM) for 16 h and then treated with perforin for 4 h. Cell death and mitochondrial iron levels were detected.
(N) Wild-type B16F10 cells or transferrin receptor-knockout (TFR⁻/⁻) B16F10 cells were treated with perforin for 4 h, and cell death was assessed.
(O,P) On day 0, 100,000 wild-type B16F10 cells were injected intraperitoneally into mice. On day 2, 5 million CellTrace Violet-labelled empty-vector B16F10 cells or TFR⁻/⁻ B16F10 cells were injected intraperitoneally. Peritoneal lavage fluid was collected on day 3, and labelled cells were stained with propidium iodide and MitoFerro Green. n = 6 mice.
Statistical significance was assessed by one-way ANOVA or t-test. *p < 0.05, **p < 0.01, ***p < 0.001, ****p < 0.0001. In vitro data are presented as mean ± s.e.m. Representative experiments with consistent results from at least three independent biological replicates are shown; statistical analyses were performed on technical replicates within the representative experiment.
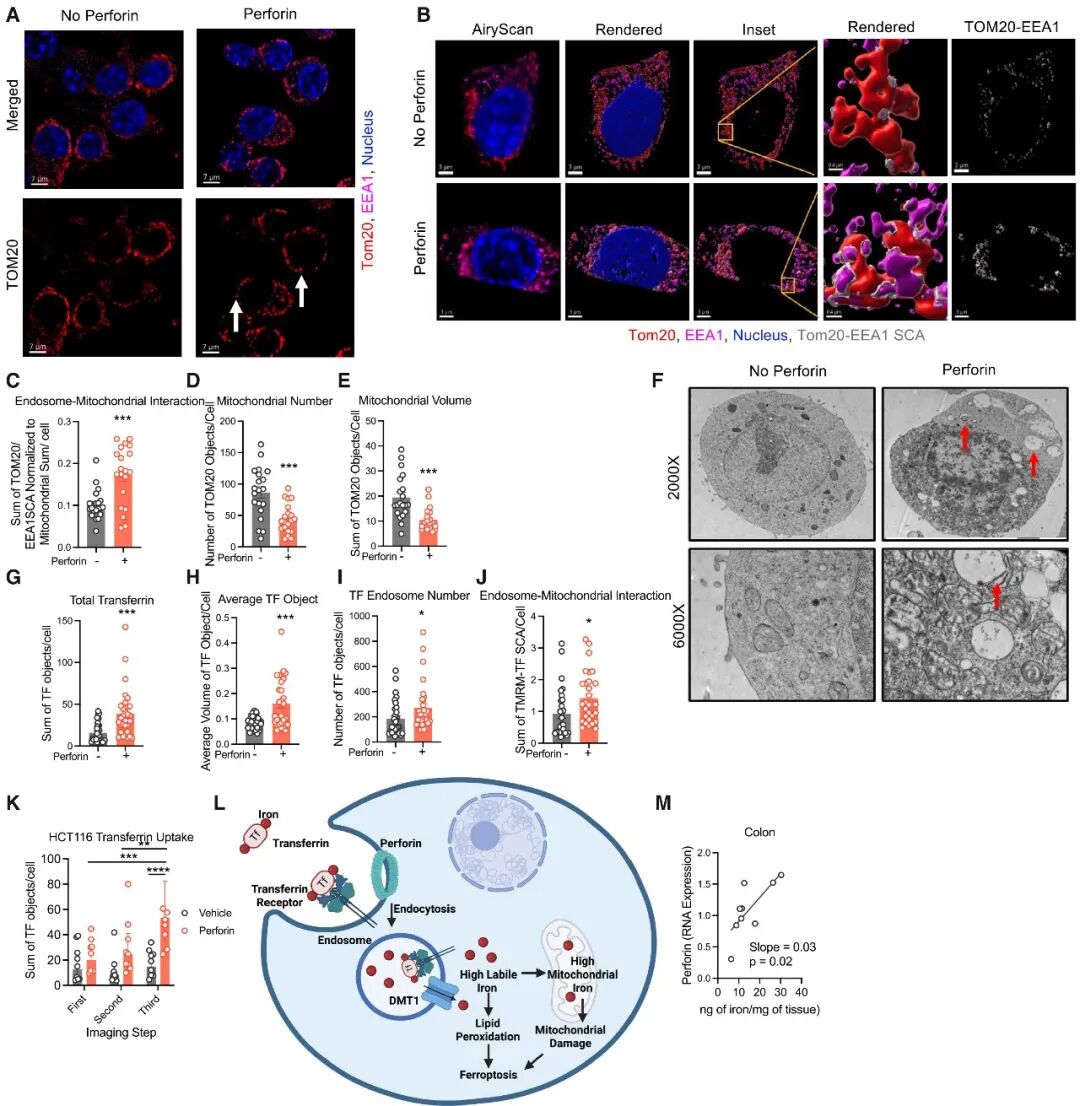
Figure 4
(A–K) HCT116 cells were treated with vehicle control or perforin for 4 h.
(A) Cells were stained for TOM20 (red), EEA1 (magenta) and DAPI (blue), and three-dimensional images were acquired using Airyscan detection mode. Arrows indicate typical ring-shaped mitochondria.
(B) Imaris software was used for automated rendering of the images in (A), and the surface contact area (SCA) between TOM20 and EEA1 structures was calculated. TOM20–EEA1 surface contact interfaces are shown in grey. Twenty cells were quantified per condition for the volume, total volume and number of TOM20, EEA1 and TOM20–EEA1 surface contact structures.
(C) Quantification of the normalized summed TOM20–EEA1 surface contact area, normalized to the total mitochondrial volume per cell.
(D,E) Quantification of the number and total volume of mitochondrial TOM20 structures per cell, respectively.
(F) Electron micrographs of HCT116 cells after perforin treatment. Arrows mark aberrant endosomes and endosome–mitochondria contact sites.
(G–I) Thirty HCT116 cells were quantified per condition for the total volume, mean volume and number of TF-endosome structures.
(J) Thirty cells were quantified per condition for the total volume of TMRM–TF surface contact structures per cell.
(K) Time-lapse imaging analysis of endosome–mitochondria interactions in live cells. The total TF signal in perforin-treated cells increased from the first to the third time-lapse frame; the total TF signal in vehicle control cells did not change significantly over this period. At the third time-lapse time point, the total TF signal in the perforin group was significantly higher than that in the vehicle control group. Nine cells were analysed per condition.
(L) Schematic illustrating the mechanism by which perforin triggers elevated iron levels.
(M) RNA was extracted from human colon tumour tissues and reverse-transcribed into cDNA. Reverse transcription PCR (RT-PCR) was performed for actin and perforin. Cell pellets were digested with nitric acid, reconstituted and analysed by mass spectrometry with reference to a standard curve. n = 9 samples.
Statistical significance was assessed by one-way ANOVA or t-test. *p < 0.05, **p < 0.01, ***p < 0.001, ****p < 0.0001. In vitro data are presented as mean ± s.e.m. Representative experiments with consistent results from at least three independent biological replicates are shown; statistical analyses were performed on technical replicates within the representative experiment.
Reference Information
Cell (IF 45.5)
Pub Date: 2026-10-23
DOI: 10.1016/j.cell.2026.09.062