已传文件:photo/1794016984.png
 This study was published in Nature Communications under the title “All-small-molecule Hydrogels for Safe and Efficient Photoprotection”.
Long‑term exposure to ultraviolet (UV) radiation can cause sunburn, skin aging and skin cancer. Conventional sunscreens typically combine organic UV filters and inorganic particles to deliver photoprotection, yet concerns remain regarding their skin penetration, systemic effects and reactive oxygen species generation. Inspired by natural photoprotective mechanisms in plants, we developed a series of all‑small‑molecule sunscreen hydrogels based on natural polyphenols via a facile one‑pot self‑assembly process. The resulting hydrogels exhibit efficient UV shielding, a high sun protection factor, robust bioadhesion, antioxidant and antibacterial activities, high visible‑light transmittance and low skin penetration tendency. These hydrogels also show favorable environmental stability and effective photoprotection in mice and Bama minipigs. This study highlights the potential of bioinspired all‑small‑molecule self‑assembly for high‑performance and safe photoprotection.
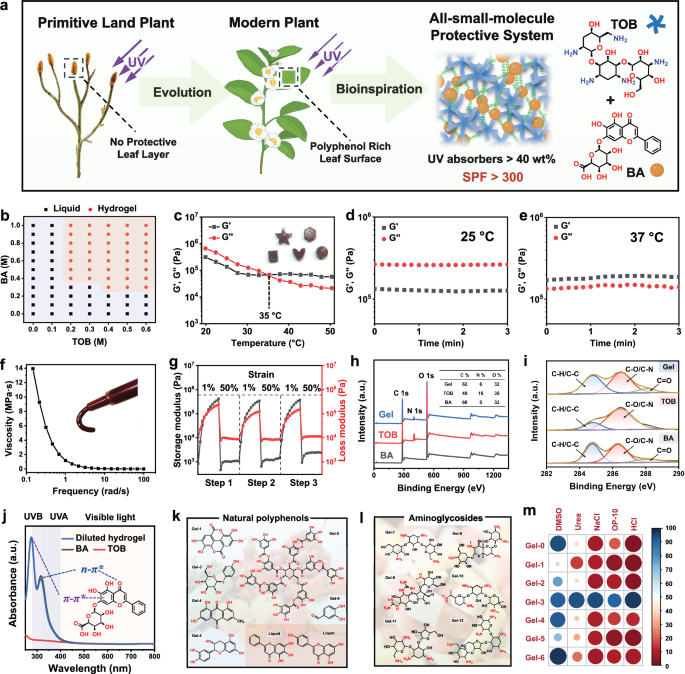
Figure 1
A bioinspired schematic illustrating the evolution of plant UV protection strategies and the design concept of the all‑small‑molecule protective hydrogel system based on natural polyphenols. b) Phase diagram of the BA‑TOB hydrogel. c) Dynamic storage modulus and loss modulus of the hydrogel at different temperatures. d) and e) Time‑dependent storage modulus and loss modulus of the hydrogel at 25 °C and 37 °C, respectively. f) Shear‑thinning behavior of the hydrogel. g) Thixotropy tested by continuous step‑strain measurements. h) Survey XPS spectra of the hydrogel, TOB and BA. i) High‑resolution C 1s spectra of the hydrogel, TOB and BA. j) UV–vis absorption spectra of BA, TOB and diluted hydrogel. k) Chemical structures of various natural polyphenols. l) Chemical structure of aminoglycoside. m) Degradation statistics of hydrogels prepared from different polyphenols in various solutions. Panel a contains elements created with BioRender. Li, H. (2026) https://BioRender.com/5xqsql5. Source data are provided as a Source Data file.
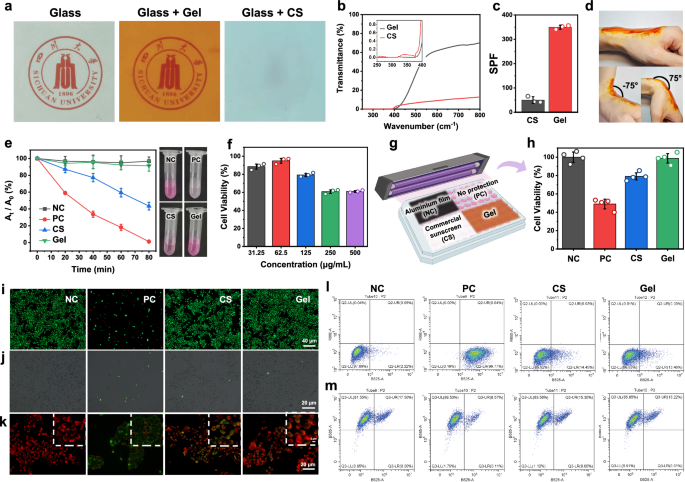
Figure 2
a Optical photographs showing the transparency comparison between blank glass and glass loaded with the same mass of hydrogel or commercial sunscreen. b UV–vis transmission spectra of the hydrogel and commercial sunscreen (CS) together with their corresponding SPF values. c Photographs demonstrating the conformal adhesion of the hydrogel on human skin during repeated bending movements. d Photodegradation curves of rhodamine B solutions protected by different materials. e MTT assay results for cell viability after hydrogel treatment. f Schematic illustration of the experimental setup for cellular UV protection tests. g Live/dead staining statistics and fluorescence signals of HaCaT cells protected by different materials. NC: control group without UV irradiation; PC: positive control group with UV irradiation. h Quantitative analysis of intracellular reactive oxygen species (ROS) levels in HaCaT cells after UV irradiation. i Effects of different materials on mitochondrial membrane depolarization. j Flow cytometric analysis of intracellular ROS levels based on DCFH‑DA staining. k Flow cytometric analysis of mitochondrial membrane potential based on JC‑1 staining. For c, n = 3 biologically independent samples. For e, n = 3 biologically independent samples. For f, n = 3 biologically independent samples. For h, n = 4 biologically independent samples. Data are presented as mean ± standard deviation (SD). Part of the elements in g were created with BioRender. Li, H. (2026) https://BioRender.com/e90igsa. Source data are provided as a Source Data file.
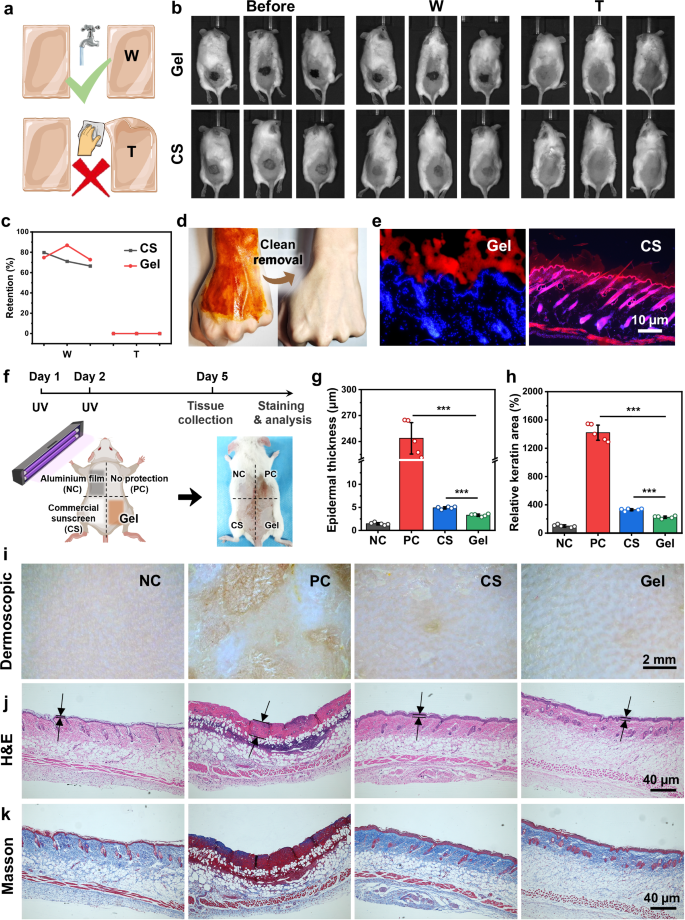 Figure 3
a Schematic illustration of the hydrogel retention behavior after water washing (W) or wet towel wiping (T). b Representative photographs and c quantitative analysis of the retention of hydrogel and commercial sunscreen (CS) after different treatments. d Photographs showing the clean, residue‑free removal of the hydrogel from skin. e Fluorescence microscopy images of Cy5‑labelled hydrogel and commercial sunscreen attached to mouse skin for 4 h. f Schematic of the sunscreen mechanism in mice. g Quantitative analysis of epidermal thickness and h keratin concentration in mice after UV irradiation. i Dermatoscopic observation, j H&E staining and k Masson staining of each experimental group. NC: control group without UV irradiation; PC: positive control group with UV irradiation. For g and h, n = 5 biologically independent animals. Data are presented as mean ± standard deviation. Statistical significance was assessed by two‑way one‑way analysis of variance. The specific P values are as follows: for g, PC versus Gel, P = 4.72×10⁻⁹; CS versus Gel, P = 6.29×10⁻¹¹; for h, PC versus Gel, P = 1.78×10⁻⁸; CS versus Gel, P = 1.26×10⁻⁵. Significance levels: P < 0.05 (), P < 0.01 () and P < 0.001 (). Panels a and f contain elements created with BioRender. Li, H. (2026) https://BioRender.com/p0p34sr. Source data are provided as a Source Data file.
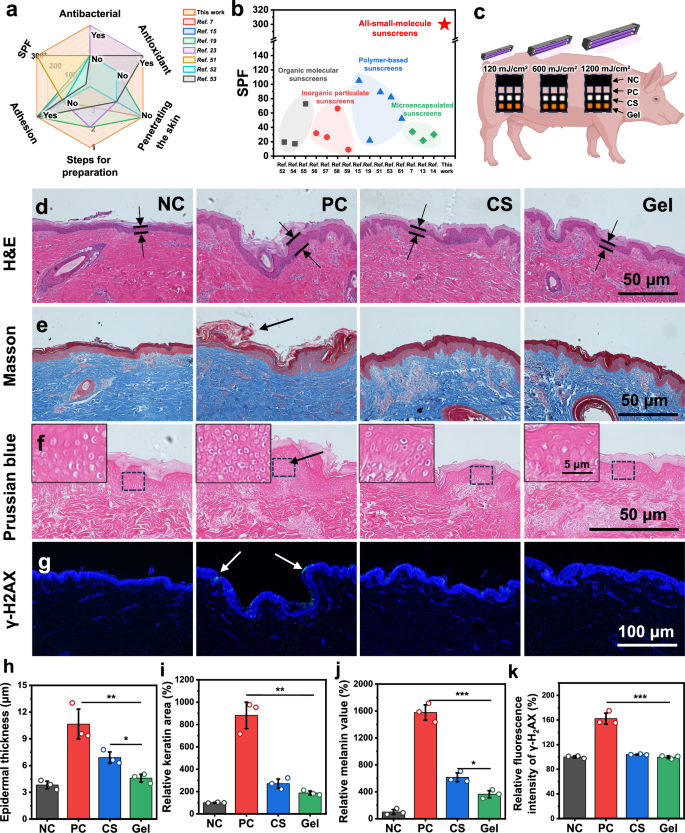
Figure 4
a Comparison of the hydrogel with other sunscreen materials in terms of SPF value, antibacterial activity, antioxidant activity, adhesion, number of preparation steps and skin permeability. b Comparison of SPF values among different sunscreen systems, highlighting the performance advantages of the all-small-molecule hydrogel over other categories. c Schematic illustration of the sunscreen mechanism in Bama minipigs. d Hematoxylin‑eosin staining, e Masson staining, f potassium ferricyanide staining and g γ‑H2AX staining results of each group. h Measurement of epidermal thickness, i quantitative analysis of keratin content, j melanin level and k DNA damage of Bama minipigs after UV irradiation. NC: control group without UV irradiation; PC: positive control group with UV irradiation; CS: commercial sunscreen. For h, i, j and k, n = 3 biologically independent samples. Data are presented as mean ± standard deviation. Statistical significance was assessed by two‑tailed one‑way analysis of variance. The specific P values are as follows: in h, PC versus Gel, P = 0.0079; CS versus Gel, P = 0.0134; in i, PC versus Gel, P = 0.0012; CS versus Gel, P = 0.0579; in j, PC versus Gel, P = 0.0002; CS versus Gel, P = 0.0139; in k, PC versus Gel, P = 0.0007; CS versus Gel, P = 0.0553. Significance levels: P < 0.05 (), P < 0.01 () and P < 0.001 (). Panel c contains elements created with BioRender. Li, H. (2026) https://BioRender.com/pu54ghy. Source data are provided as a Source Data file.
Reference Information
Nature Communications (IF 18.1)
Pub Date: 08 Aug 2026
DOI: 10.1038/s41467-026-75884-y
We specialize in custom nano-medical functional materials. We conduct targeted development to tailor structure, particle size and surface modification for your experiments. Full characterization, iterative optimization and technical support are available for targeted delivery, bioimaging and nanomedicine studies. Send your evaluation plans to us.
Engineer Zhang: 17715390137
Engineer Chen: 18914047343